A SIEM-lite for a home network in one morning
My home gateway has an intrusion prevention system (IPS) and a lot of logs, but reading them meant clicking through its own UI, exporting CSVs and guessing. Its local log storage is small and rotates quickly, and the gateway only has 3 GB of RAM to begin with. I wanted three things:
- An email the moment the IPS sees something, with the signature, the device and the destination in the subject.
- History I control, searchable for at least 30 days.
- The gateway’s events and my server’s own logs in one place, so I can line up a firewall block with what the server saw at the same second.
A full SIEM (Wazuh, Graylog, Security Onion) would have done it, at the cost of 4–16 GB of RAM, an OpenSearch cluster and agents everywhere. That’s built for fleets, not a house. I already ran Grafana on a Linux server for metrics, so I added logs to it.
The pipeline
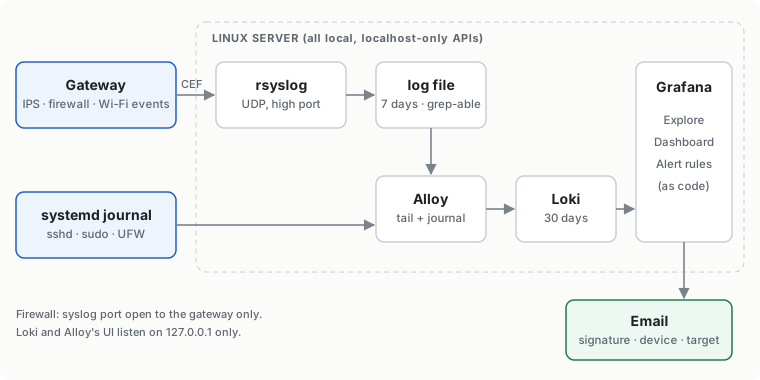
| Piece | Role | Why this choice |
|---|---|---|
| rsyslog | receives the gateway’s syslog on a high UDP port and writes a plain file | The gateway’s syslog isn’t strict RFC 3164/5424; rsyslog accepts it as is. The plain file doubles as a grep fallback when Grafana is down. A port above 1024 means no root needed. |
| Grafana Alloy | tails that file and reads the systemd journal | One agent for both sources. Labels kept few (job, host, unit, level); everything else is parsed at query time. |
| Loki | stores logs, 30-day retention | Single binary, local disk, listens on localhost only. About 190 MB of RAM; Alloy about 260 MB. |
| Grafana | Explore, a dashboard, alert rules | Already there for metrics, so no new web app to secure. |
The host firewall only accepts the syslog port from the gateway’s address. Loki and Alloy’s UI bind to 127.0.0.1, and both have usage reporting turned off. Everything is installed by one script that dry-runs by default and prints its own rollback.
What the gateway actually sends
The first surprise: the gateway’s “SIEM server” setting sends events, not traffic. Its per-connection flow log stays in its own UI. At a quiet hour I got one line in five minutes. What does arrive is rich CEF:
CEF:0|Ubiquiti|UniFi Network|10.x|200|Threat Detected|7|UNIFIcategory=Security
  act=allowed UNIFIrisk=medium UNIFIdirection=outgoing
  UNIFIsrcClientHostname=<server> UNIFIdstDomain=testmyids.com
  UNIFIipsSignature=GPL ATTACK_RESPONSE id check returned root UNIFIipsSignatureId=2100498
Two parsing notes:
- Values contain spaces (device aliases such as
Phone a1:b2), sologfmtbreaks. I useregexpstages with lazy matches up to the nextUNIFIkey. - Incoming events use
src=,dst=anddpt=instead of client names. My first dashboard line printed· → (GB)for an internet scanner until I added those fields as fallbacks.
Testing an IDS alert without waiting for an attack
I didn’t want to write the alert against a guessed format. A real detection, on demand, takes one command:
curl http://testmyids.com
# uid=0(root) gid=0(root) groups=0(root)
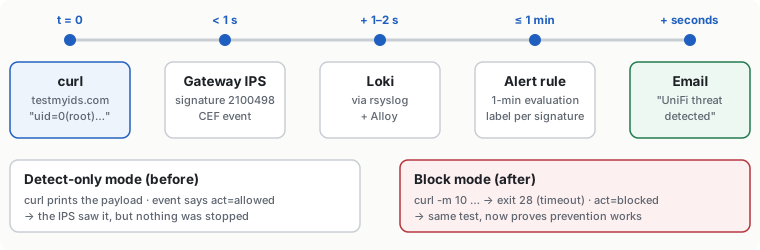
That response matches a long-standing Emerging Threats signature (“GPL ATTACK_RESPONSE id check returned root”). The line reached Loki seconds later, and I wrote the alert against its real fields:
sum by (signature, risk, action, client, domain, src, dst, port, direction) (
  count_over_time({job="gateway"} |= "UNIFIcategory=Security"
    | regexp "UNIFIipsSignature=(?P<signature>.+?) UNIFI"
    | regexp "UNIFIrisk=(?P<risk>\\S+)"
    | regexp "act=(?P<action>\\S+)"
    ... [10m]))
Each label combination becomes its own alert instance, so the email subject names the signature and the device. A second run of the curl produced the email.
What it found on day one
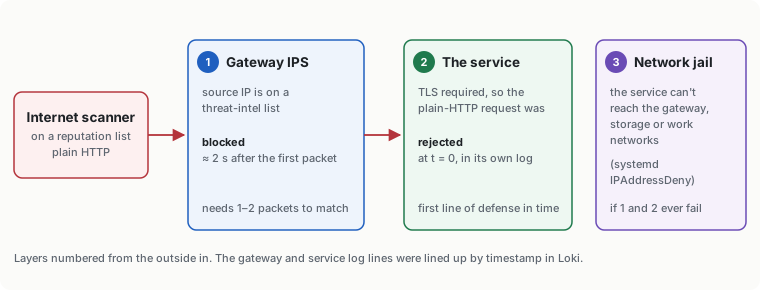
act=allowedon everything. The IPS was in detect-only mode. I switched it to block, reran the test (curlnow times out), and the next email saidblocked.- Two internet scanners on reputation lists knocked on the one service I expose. The first was let through by detect-only mode, and the service itself rejected the plain-HTTP request because it requires TLS. The second was blocked by the IPS two seconds after its first packet. Lining up the gateway event with the service’s own log shows both layers working.
- A laptop probing the gateway’s admin page got blocked by a zone policy that only allows three admin devices. The IPS also flagged it as an old router worm (“TheMoon”, an
/HNAP1/probe). It was network-discovery software, not a worm, and now it’s a documented false positive. - Most of the server’s firewall blocks came from one streaming stick. It was answering discovery requests that the server itself sends out: SSDP from the browser’s cast feature and a media server’s DLNA renderer search. UFW drops the unicast replies because conntrack can’t match them to a multicast question. The fix was on the server (fewer searches), not the TV.
Mistakes worth keeping
- A “logs stopped” alert with a 30-minute window fired on the first quiet morning. With an events-only feed, silence is normal. The window is now 24 hours: a whole day without a single Wi-Fi join is a real outage.
- A dashboard panel grouped by destination port hit Loki’s 500-series limit, because every random reply port became a series. It now keeps service ports below 10000.
- Bar gauges showed a single unnamed number. Grafana collapses Loki instant queries into one frame, so I switched them to range queries with few data points.
- Grafana’s own query log matched my searches. Grafana logs every query it runs, including strings like
Failed password, which inflated a login-failure counter. Text-search panels now exclude its unit.
Results
- One dashboard: security events with readable lines, devices (joins, leaves, and signal strength at connect and disconnect parsed from the event text, which turned out useful for planning access points), and the server’s journal.
- Four alerts: IPS hit (critical), unusual gateway event, logs stopped, and gateway memory high.
- Proven end to end with a harmless test, in one morning. The same data now feeds a set of detection rules mapped to MITRE ATT&CK, which will be the next write-up.